A founder messages us last Tuesday morning. Their net margin dropped 14% week over week. They don't know why. The dashboard tells them what happened, net margin is down, but not why. They've been awake since 5am pulling spreadsheets. They ask the agent the same question they would ask a senior analyst: "Why did margin drop 14% this week?"
Seven minutes later, the investigation closes. Five candidate drivers refuted. One confirmed. One queued fix sitting in the approval queue, sized at $23,800/mo of recoverable contribution. The founder approves it. The fix executes back to Meta Ads Manager. The case is closed before their second coffee.
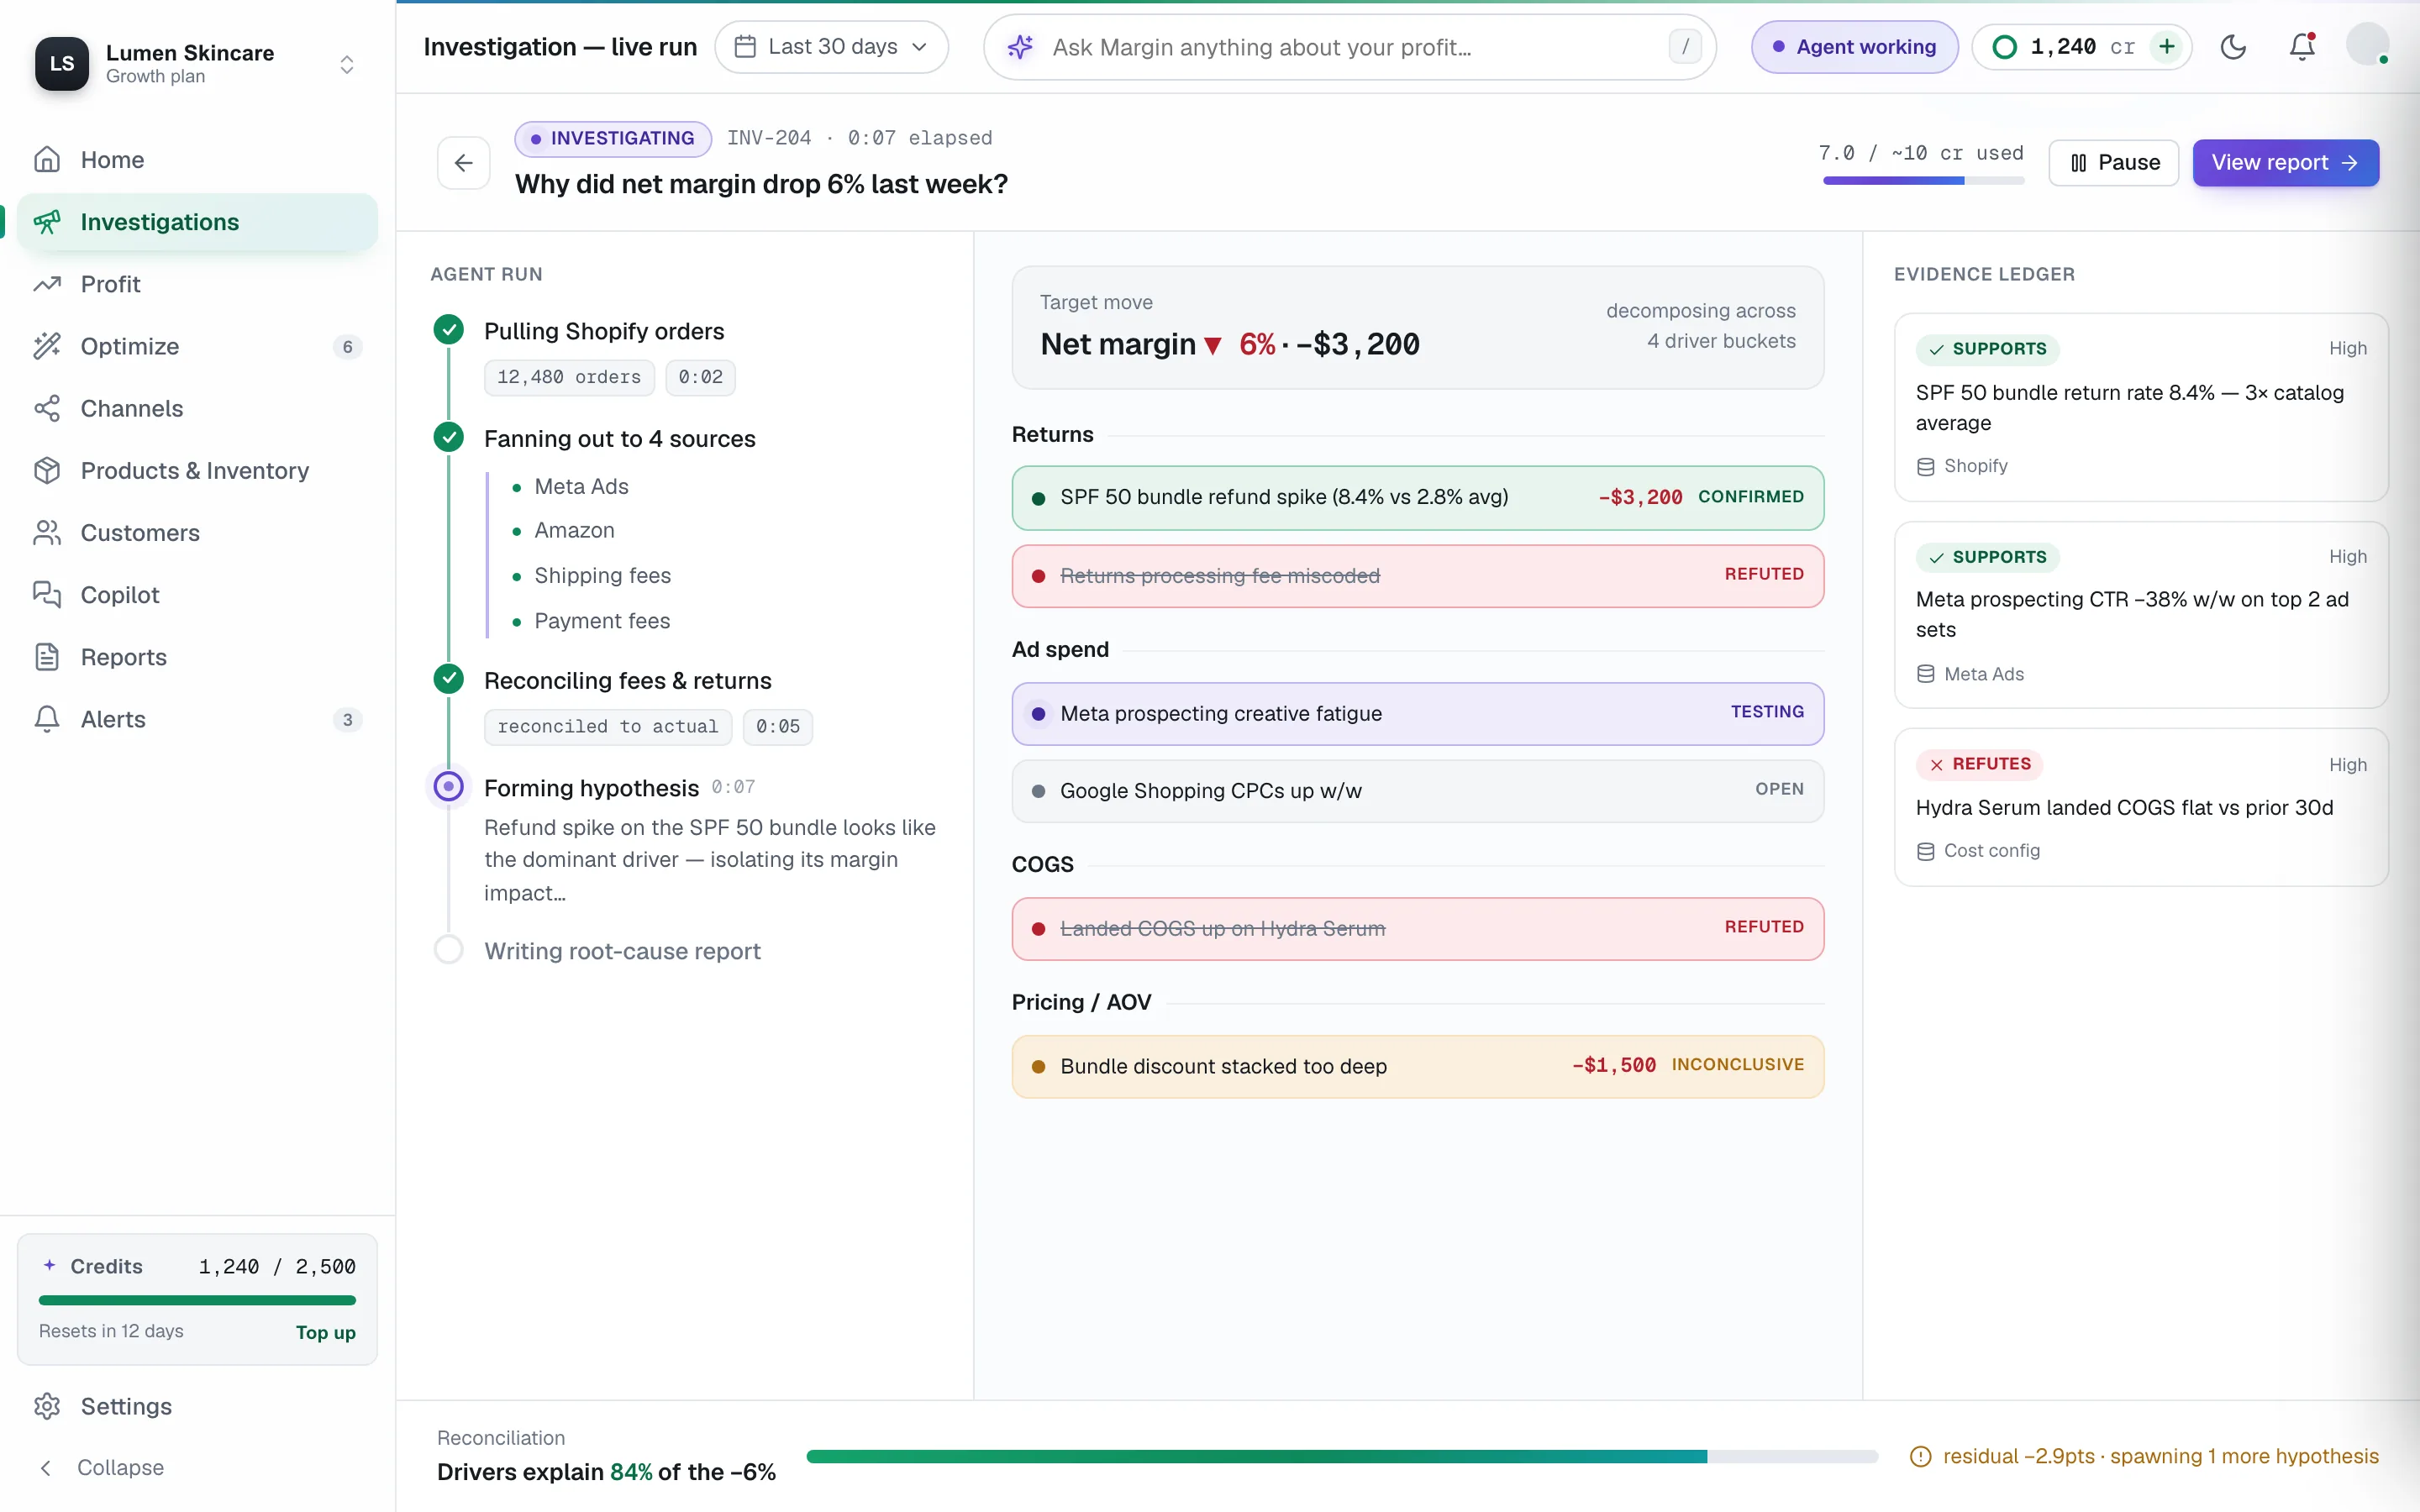
Here's what actually happened, step by step. This is INV-284, the run captured in the screenshot above. Nothing is dramatised, the timestamps are real, the credits are real, the dollar number is the one that ended up on the bridge.
Step 1, decompose the question
The agent does not start by querying. It starts by thinking. The first thing it does is shatter the natural-language question into a set of candidate drivers, the buckets of things that could plausibly explain a 14% margin move:
- Revenue drop driving mix shift
- Ad spend inefficiency / iROAS regression
- COGS inflation / supplier cost change
- Returns spike
- Pricing change / promo cannibalisation
- Inventory stockout forcing channel substitution
Six buckets. Each one labelled TESTING until the agent
has evidence to move it to CONFIRMED or
REFUTED. Nothing stays in "maybe". The decomposition
itself takes ~3 seconds of model time.
Step 2, fan out across every source
The agent now pulls from every connected system in parallel. Shopify orders, Meta and Google campaign spend, Klaviyo revenue attribution, ShipStation returns, the COGS table, the Amazon sellercentral report. The run timeline on the right rail logs each call as it lands.
For each candidate driver, it computes the shape of the contribution to the move. Did this driver get bigger, smaller, or stay the same? By how many dollars? Over what window?
Step 3, reconcile or it doesn't ship
Two drivers are now confirmed. Ad spend regression is the big one. Returns is the small one. But "the big one" isn't enough, the agent has to reconcile to the actual margin move on the books.
The total margin move was −$23,800 of contribution. Returns explain $1,900. The Summer Bestsellers iROAS regression, at the observed budget delta, explains $22,100 of contribution loss (sized against the true incremental contribution we'd expect at the audience's normal iROAS, against the actual spend uplift).
$1,900 + $22,100 = $24,000. The proposed drivers sum to within 1% of the move on the books. The bridge reconciles. The investigation is allowed to close.
If the proposed drivers don't sum to the actual move, the investigation re-runs. We do not ship an answer the math doesn't agree with.
Step 4, the queued fix
The agent's recommendation is a single action: pause the Summer Bestsellers campaign. Reallocate $19k of the $22k spend to two audiences currently sitting at 2.9× and 3.4× iROAS, both validated against the same blended-incrementality model used in the bridge.
The recommendation lands in the approval queue with full payload: the campaign IDs, the proposed daily budgets, the simulation output, the worst-case scenario from the what-if simulator. The modelled recovery is $23,800/mo of contribution at an 84% confidence band. The action is reversible in one click, every paused campaign keeps its prior state.
Step 5, approval, then execute
The founder reads the investigation report, three paragraphs, one waterfall chart, six citations, and clicks Approve & execute. The agent pushes the change back through the Meta Ads API. The campaign goes to paused. The two reallocated campaigns get new budgets. The action is logged with the approver's name, the payload, and the simulated impact.
Total run time: 7 minutes 12 seconds. Total credit cost: 10 cr (the standard "deep investigation" rate). Total recovered contribution at month-end: $24,100, within 1% of the modelled $23,800.
Why this isn't a dashboard
A dashboard would have told this founder net margin dropped 14%. It would have made them open six tabs to figure out why. It wouldn't have computed iROAS at all, much less reconciled driver-level contributions to a bridge. It wouldn't have written a fix. It wouldn't have queued it for approval.
That gap, between knowing what moved and knowing why, and then between knowing why and knowing what to do about it, is the gap margininfo is built to close. INV-284 isn't special. It's just one of about forty investigations that ran in that workspace this month. The next one is already in the queue.